Friday, April 21, 2006

Having Fun with PySQLite

I had a chance to test pysqlite, a Python wrapper for SQLite Database System. pysqlite needs the following dependencies :

  • Operating System and C Compiler
  • SQLite version 3.0.8 or later (for pysqlite 2.2.0)
  • Python 2.3 or later
After download the latest version (2.2.2) I did the followings to install pysqlite to my system :

$ tar xvzpf pysqlite-2.2.2.tar.gz
pysqlite-2.2.2/

pysqlite-2.2.2/doc/

pysqlite-2.2.2/doc/code

...

pysqlite-2.2.2/setup.cfg

pysqlite-2.2.2/setup.py

pysqlite-2.2.2/PKG-INFO


$ cd pysqlite-2.2.2/


$ python setup.py build

running build

running build_py

creating build

creating build/lib.linux-i686-2.4

creating build/lib.linux-i686-2.4/pysqlite2

...


# python setup.py install

running install

running build

running build_py

running build_ext

running install_lib

...


In my system, the above command will install pysqlite to /usr/lib/python2.4/site-packages directory


Next I test whether the installation success or not :


$ python

Python 2.4 (#1, Mar 22 2005, 21:42:42)
[GCC 3.3.5 20050117 (prerelease) (SUSE Linux)] on linux2
Type "help", "copyright", "credits" or "license" for more information.
>>> from pysqlite2 import test
>>> test.test()
......................................................................
----------------------------------------------------------------------
Ran 164 tests in 1.060s
OK

>>>

Next
I type several lines of Python code to test PySQLite. Here is the code. Please beware this is just a simple application :


#!/usr/bin/env python

from pysqlite2 import dbapi2 as sqlite
import os

DB_FILE = "mydb"

musics = [
("Michael W Smith", "In My Arms Again"),
("Chayanne", "Ye Te Amo"),
("Marc Anthony", "Everything You Do")
]

if os.path.exists(DB_FILE):
os.remove(DB_FILE)

con = sqlite.connect(DB_FILE)

# create table
con.execute("""
create table music
(
singer varchar(30),
song varchar(30)
)
""")
print "Success creating table",'"%s"' % DB_FILE

# insert table
con.executemany("insert into music(singer,song) values (?,?)", musics)

# print table contents
print "\nThe content of", DB_FILE
print "=" * 20,"\n"

for row in con.execute("select singer,song from music"):
print '%s : %s' % (row[0],row[1])

con.close()

Wednesday, April 19, 2006

Why Windows is less secure than Linux

I just read a blog entry title "Why Windows is less secure than Linux". In that blog there are some interesting pictures describing system calls in Apache and IIS.

The first picture is of the system calls that occur on a Linux server running Apache.
The second image is of a Windows Server running IIS.

Just wondering who can master the intricacies of IIS, it's so darn complex. :D

Monday, April 17, 2006

Another Webserver Performance Tool : autobench

In my last blog, I wrote about httperf. This time I will write about another tool. The tool
is autobench. It is a wrapper for httperf.

To install autobench, just do the followings :

$ make
# make install


To run it, type :

$ autobench
Autobench configuration file not found
- installing new copy in /home/tedi/.autobench.conf

Installation complete - please rerun autobench

I use the example from autobench website :

$ autobench --single_host --host1 localhost --uri1 /index.html --quiet --low_rate 20 --high_rate 200 --rate_step 20 --num_call 10 --num_conn 5000 --timeout 5 --file result.tsv

Will benchmark "localhost/index.html", with a series of tests starting at 20 connections per second (with 10 requests per connection), and increasing by 20 connections per second until 200 connections a second are being requested.

Each test will comprise a total of 5000 connections, and any responses which took longer than 5 seconds to arrive will be counted as errors. The results will be saved in the file 'result.tsv'.


And here is the result :

dem_req_rate req_rate_localhost con_rate_localhost min_rep_rate_localhost avg_rep_rate_localhost max_rep_rate_localhost stddev_rep_rate_localhost resp_time_localhost net_io_localhost errors_localhost
200 200.0 20.0 200.0 200.0 200.0 0.0 0.1 814.0 0
400 400.1 40.0 400.0 400.0 400.0 0.0 0.1 1628.0 0
600 600.1 60.0 600.0 600.0 600.1 0.0 0.1 2442.0 0
800 800.1 80.0 800.0 800.1 800.1 0.0 0.1 3256.1 0
1000 1000.2 100.0 1000.0 1000.1 1000.1 0.0 0.1 4070.0 0
1200 1200.2 120.0 1200.0 1200.1 1200.1 0.0 0.1 4884.0 0
1400 1400.3 140.0 1400.0 1400.1 1400.1 0.1 0.1 5698.1 0
1600 1600.3 160.0 1600.0 1600.1 1600.1 0.1 0.1 6512.0 0
1800 1800.2 180.0 1800.0 1800.1 1800.1 0.1 0.1 7325.7 0
2000 2000.3 200.0 1999.9 2000.1 2000.1 0.1 0.1 8139.8 0

Testing Web Performance with httperf

I got another tool for testing webperformance. This tool is httperf. It was developed by David Mosberger from HP.

The installation process is very smooth and usual :

$ ./configure
$ make

# make install


Next I try httperf to issue 1000 HTTP requests :

$ httperf --server localhost --port 80 --num-conns 100 --rate 10 --timeout 2

The above command will create 100 connections during 10 seconds (1000 requests).

Here is the result (it is not pretty) :

Total: connections 100 requests 100 replies 100 test-duration 9.901 s

Connection rate: 10.1 conn/s (99.0 ms/conn, <=1 concurrent connections)
Connection time [ms]: min 0.1 avg 0.3 max 15.0 median 0.5 stddev 1.5
Connection time [ms]: connect 0.0
Connection length [replies/conn]: 1.000

Request rate: 10.1 req/s (99.0 ms/req)
Request size [B]: 60.0

Reply rate [replies/s]: min 10.0 avg 10.0 max 10.0 stddev 0.0 (1 samples)
Reply time [ms]: response 0.3 transfer 0.0
Reply size [B]: header 217.0 content 3880.0 footer 0.0 (total 4097.0)
Reply status: 1xx=0 2xx=100 3xx=0 4xx=0 5xx=0

CPU time [s]: user 0.38 system 9.50 (user 3.9% system 95.9% total 99.8%)
Net I/O: 41.0 KB/s (0.3*10^6 bps)

Errors: total 0 client-timo 0 socket-timo 0 connrefused 0 connreset 0
Errors: fd-unavail 0 addrunavail 0 ftab-full 0 other 0


I leave the interpretation of the above statistics to the readers.

Wednesday, April 12, 2006

Testing Webserver Performance using IDX-Tsunami

Last night I tried to use IDX-Tsunami. It is a distributed load testing tool. It is protocol-independent and can currently be used to stress testing HTTP, SOAP and Jabber servers.

After download it from its website the installation process was very easy (if you've already had Erlang OTP).

Installation

To install IDX-Tsunami, I just did the followings :

$ tar xvzpf idx-tsunami-1.1.0.tar.gz
$ cd idx-tsunami-1.1.0/
$ ./configure
$ make
# make install

If there is no error, IDX-Tsunami will be installed in directory /usr/local[/bin|/share/doc/|/lib/]

Configuration

If the installation process is easy, the configuration part is quite challenging. :D But luckily I can managed to get the configuration file working.

Here is the scenario I use :

I only have one machine name "suse". It has an IP address at 192.168.1.1. And
here is the entry of my /etc/hosts file :
#
# IP-Address Full-Qualified-Hostname Short-Hostname
#

192.168.1.1 suse.site suse

Please do not use IP "127.0.0.1", it doesn't work on my system.

I want to do stress testing to my webserver at "suse" port 80. It contains
a simple webpage in "index.html".

I can't show the config file here. It's hidden by this blogger.

Put that config file in $HOMEDIR/.idx-tsunami/

To help you in creating session, there is a helper to do that (recorder). Just start the recorder :

$ idx-tsunami recorder


it will listen on port 8090

Then set your browser to use proxy at that port, and browse the website you want to measure.

When you're done, just give the following command :


$ idx-tsunami stop_recorder

The session name will be created in recorder log file. Here is the content of that file in my system :
< name="'rec20060414-08:13'" popularity="'100'" type="'ts_http'">
<>
< /session>

Just put those lines in idx-tsunami.xml file.

After finish configuring idx-tsunami config file, start the idx-tsunami :

$ idx-tsunami start
Creating idx-tsunami log directory /home/tedi/.idx-tsunami/log
Starting IDX-Tsunami


If there is no error, it will create a directory named "log". In that directory there will be another subdirectory named with current-date and current-time.

In my system, it looks like this :

tedi@suse:~/.idx-tsunami>ll log/
drwxr-xr-x 2 tedi users 4096 2006-04-11 21:04 20060411-14:04


The time is in GMT format.

You can check the status of IDX-Tsunami by using this command :

tedi@suse:~> idx-tsunami status
IDX-Tsunami is running [OK]
Current request rate: 0.782037 req/sec
Current users: 14
Current phase: 1


After that you can wait till the end of the test. In my configuration, the test takes
around 10 minutes to finish.

If anytime you want to stop the idx-tsunami before it is finished you can do that by issuing :

$ idx-tsunami stop

Next, you can analyze the results, change the parameters in the configuration file and relaunch another benchmark.

Reporting

To create reports, idx-tsunami needs Template Toolkit and gnuplot. So I installed those packages first.

After successfully installed those packages, I created the statistics report by
issuing the following :

$ cd .idx-tsunami/log/20060414-08:55
$ /usr/local/lib/idx-tsunami/bin/analyse_msg.pl --stats idx-tsunami.log --html --plot


That script will create report.html.

Here is the content of "report.html" in my system :


Tuesday, April 11, 2006

A Simple Webserver Performance Comparison Test

Last week, I had a long weekend (3 days off). It made me very bored. During that time I read PC Magazine. In it there is an article regarding several web performance tools. One of them is ab2 that is included in the Apache webserver.

For a long time I want to measure the performance of several webservers. That article inspired me to test the performance of several webservers.

The webservers I want to measure are Apache 2.0.55, Yaws
, lighttpd and WEBrick (included with Ruby, actually it is not a webserver per se but a low-level web framework). My testing method may not be scientific enough, but at least it gives me a clue about the performance of the webservers I mentioned above.

Here are the methods I will use :

  • create a static webpage (it is a copy of http://tedi.heriyanto.net)
  • Apache will listen on port 80
  • Lighttpd will listen on port 80
  • Yaws will listen on port 8000
  • WEBrick will listen on port 8080
  • using ab2 request for a static webpage for 200 times from each webserver
  • using ab2 request for a static webpage for 2000 times from each webserver
Notes :
In this document, I will not give details about the installation of each webserver. You can consult with the appropriate documents for that.


Apache Setup

I setup the Apache so it can handle each user website from the URL : http://website/~user/

It's a default setting in my SUSE Prof 9.3 Apache (version 2.0.55).


The directory is
/home/tedi/public_html
There I put file
index.html to that directory

Lighttpd Setup

I just use the default Lighttpd configuration.
The webpage is store in /srv/www/htdocs

Yaws Setup


I created a special directory for Yaws (
test-yaws) and it contains static webpage (index.html). I configure Yaws (yaws.conf) with the following virtual server :


WEBrick Setup

For WEBrick, I had to write a simple webserver code like the following :

#!/usr/bin/env ruby
require 'webrick'
include WEBrick

def start_webrick(config={})
config.update(:Port => 8080)
server = HTTPServer.new(config)

['INT', 'TERM'].each {|signal|
trap(signal) {server.shutdown}
}

server.start
end

start_webrick(:DocumentRoot => '/home/tedi/public_html')


Starting Apache


To start apache just use the following command :


# rcapache start


Starting Lighttpd

To start lighttpd just type the following command :


# /etc/init.d/lighttpd start

Starting Yaws

To start Yaws, I use the following command :


$ bin/yaws -i
Erlang (BEAM) emulator version 5.4.12 [source] [hipe]

Eshell V5.4.12 (abort with ^G)
1>
=INFO REPORT==== 10-Apr-2006::13:30:21 ===
Yaws: Using config file /home/tedi/yaws.conf
yaws:Add path "/home/tedi/software/erlang/yaws/scripts/../examples/ebin"
yaws:Add path "/home/tedi/software/erlang/yaws/examples/ebin"
yaws:Running with id="default"
Running with debug checks turned on (slower server)
Logging to directory "/home/tedi/yaws_logs"

=INFO REPORT==== 10-Apr-2006::13:30:21 ===
Yaws: Listening to 0.0.0.0:8000 for servers
- http://suse:8000 under /home/tedi/software/erlang/yaws/scripts/../www
- http://localhost:8000 under /home/tedi/test-yaws


Starting WEBrick

To start WEBrick just type the following command :

$ ruby webserver.rb
[2006-04-10 13:26:52] INFO WEBrick 1.3.1
[2006-04-10 13:26:52] INFO ruby 1.8.2 (2004-12-25) [i686-linux]
[2006-04-10 13:26:52] WARN TCPServer Error: Address already in use - bind(2)
[2006-04-10 13:26:52] INFO WEBrick::HTTPServer#start: pid=6893 port=8080


Testing

Here are the commands I used to test Apache webserver performance :

/usr/sbin/ab2 -n 200 -c 10 http://localhost/~tedi/index.html
/usr/sbin/ab2 -n 2000 -c 10 http://localhost/~tedi/index.html


Here are the commands I used to test Lighttpd webserver performance :

/usr/sbin/ab2 -n 200 -c 10 http://localhost/index.html
/usr/sbin/ab2 -n 2000 -c 10 http://localhost/index.html


Here are the commands I used to test Yaws webserver performance :


/usr/sbin/ab2 -n 200 -c 10 http://localhost:8000/index.html
/usr/sbin/ab2 -n 2000 -c 10 http://localhost:8000/index.html


Here are the commands I used to test WEBrick webserver performance :

/usr/sbin/ab2 -n 200 -c 10 http://localhost:8080/index.html
/usr/sbin/ab2 -n 2000 -c 10 http://localhost:8080/index.html


Results

For 200 connections

Apache


Software: Apache/2.0.55
Document Length: 4782 bytes

Concurrency Level: 10
Time taken for tests: 0.89339 seconds
Complete requests: 200
Total transferred: 1013400 bytes
HTML transferred: 956400 bytes
Requests per second: 2238.66 [#/sec] (mean)
Time per request: 4.467 [ms] (mean)
Time per request: 0.447 [ms] (mean, across all concurrent requests)
Transfer rate: 11070.19 [Kbytes/sec] received

Connection Times (ms)
min mean[+/-sd] median max
Connect: 0 0 0.9 0 4
Processing: 2 2 1.4 3 6
Waiting: 1 1 0.8 1 4
Total: 3 3 1.0 3 6

Percentage of the requests served within a certain time (ms)
50% 3
66% 3
75% 3
80% 3
90% 6
95% 6
98% 6
99% 6
100% 6 (longest request)

Yaws

Server Software: Yaws/1.57
Document Length: 4782 bytes

Concurrency Level: 10
Time taken for tests: 0.171134 seconds
Complete requests: 200
Total transferred: 1026120 bytes
HTML transferred: 975528 bytes
Requests per second: 1168.67 [#/sec] (mean)
Time per request: 8.557 [ms] (mean)
Time per request: 0.856 [ms] (mean, across all concurrent requests)
Transfer rate: 5855.06 [Kbytes/sec] received

Connection Times (ms)
min mean[+/-sd] median max
Connect: 0 1 1.1 2 5
Processing: 1 2 1.0 3 6
Waiting: 0 1 1.0 1 4
Total: 4 4 0.8 4 7

Percentage of the requests served within a certain time (ms)
50% 4
66% 4
75% 4
80% 4
90% 5
95% 7
98% 7
99% 7
100% 7 (longest request)

Lighttpd

Server Software: lighttpd/1.4.11
Document Length: 4782 bytes

Concurrency Level: 10
Time taken for tests: 0.53806 seconds
Complete requests: 200
Total transferred: 1003000 bytes
HTML transferred: 956400 bytes
Requests per second: 3717.06 [#/sec] (mean)
Time per request: 2.690 [ms] (mean)
Time per request: 0.269 [ms] (mean, across all concurrent requests)
Transfer rate: 18195.00 [Kbytes/sec] received

Connection Times (ms)
min mean[+/-sd] median max
Connect: 0 0 1.0 1 3
Processing: 1 1 0.8 1 4
Waiting: 0 0 0.7 0 3
Total: 2 2 0.6 2 4

Percentage of the requests served within a certain time (ms)
50% 2
66% 2
75% 2
80% 2
90% 4
95% 4
98% 4
99% 4
100% 4 (longest request)


WEBrick

Server Software: WEBrick/1.3.1
Document Length: 4782 bytes

Concurrency Level: 10
Time taken for tests: 1.435260 seconds
Complete requests: 200
Total transferred: 1009582 bytes
HTML transferred: 960496 bytes
Requests per second: 139.35 [#/sec] (mean)
Time per request: 71.763 [ms] (mean)
Time per request: 7.176 [ms] (mean, across all concurrent requests)
Transfer rate: 686.29 [Kbytes/sec] received

Connection Times (ms)
min mean[+/-sd] median max
Connect: 0 0 0.2 0 1
Processing: 35 55 23.6 54 277
Waiting: 20 38 23.4 37 258
Total: 35 55 23.7 54 278

Percentage of the requests served within a certain time (ms)
50% 54
66% 56
75% 58
80% 59
90% 66
95% 70
98% 77
99% 272
100% 278 (longest request)


For 2000 connections

Apache

Software: Apache/2.0.55
Document Length: 4782 bytes

Concurrency Level: 10
Time taken for tests: 0.658329 seconds
Complete requests: 2000
Total transferred: 10134000 bytes
HTML transferred: 9564000 bytes
Requests per second: 3037.99 [#/sec] (mean)
Time per request: 3.292 [ms] (mean)
Time per request: 0.329 [ms] (mean, across all concurrent requests)
Transfer rate: 15032.00 [Kbytes/sec] received

Connection Times (ms)
min mean[+/-sd] median max
Connect: 0 0 0.5 0 4
Processing: 1 2 0.8 2 7
Waiting: 1 1 0.5 1 5
Total: 2 2 1.0 2 7

Percentage of the requests served within a certain time (ms)
50% 2
66% 3
75% 3
80% 3
90% 3
95% 4
98% 6
99% 6
100% 7 (longest request)


Lighttpd

Server Software: lighttpd/1.4.11
Document Length: 4782 bytes

Concurrency Level: 10
Time taken for tests: 0.416057 seconds
Complete requests: 2000
Total transferred: 10060090 bytes
HTML transferred: 9592692 bytes
Requests per second: 4807.03 [#/sec] (mean)
Time per request: 2.080 [ms] (mean)
Time per request: 0.208 [ms] (mean, across all concurrent requests)
Transfer rate: 23612.15 [Kbytes/sec] received

Connection Times (ms)
min mean[+/-sd] median max
Connect: 0 0 0.4 0 2
Processing: 0 1 0.7 1 5
Waiting: 0 0 1.0 1 4
Total: 0 1 0.8 1 7

Percentage of the requests served within a certain time (ms)
50% 1
66% 1
75% 2
80% 2
90% 2
95% 3
98% 3
99% 4
100% 7 (longest request)


Yaws

Server Software: Yaws/1.57
Document Length: 4782 bytes

Concurrency Level: 10
Time taken for tests: 1.32380 seconds
Complete requests: 2000
Total transferred: 10060000 bytes
HTML transferred: 9564000 bytes
Requests per second: 1937.27 [#/sec] (mean)
Time per request: 5.162 [ms] (mean)
Time per request: 0.516 [ms] (mean, across all concurrent requests)
Transfer rate: 9515.88 [Kbytes/sec] received

Connection Times (ms)
min mean[+/-sd] median max
Connect: 0 0 0.0 0 0
Processing: 0 3 18.1 2 605
Waiting: 0 3 18.1 2 605
Total: 0 3 18.1 2 605

Percentage of the requests served within a certain time (ms)
50% 2
66% 2
75% 3
80% 3
90% 4
95% 4
98% 6
99% 7
100% 605 (longest request)


WEBrick

Server Software: WEBrick/1.3.1
Document Length: 4782 bytes

Concurrency Level: 10
Time taken for tests: 13.272744 seconds
Complete requests: 2000
Total transferred: 10054582 bytes
HTML transferred: 9568096 bytes
Requests per second: 150.68 [#/sec] (mean)
Time per request: 66.364 [ms] (mean)
Time per request: 6.636 [ms] (mean, across all concurrent requests)
Transfer rate: 739.71 [Kbytes/sec] received

Connection Times (ms)
min mean[+/-sd] median max
Connect: 0 4 95.0 0 2999
Processing: 4 61 15.2 66 251
Waiting: 0 43 13.4 48 236
Total: 27 65 95.4 66 3059

Percentage of the requests served within a certain time (ms)
50% 66
66% 67
75% 68
80% 69
90% 70
95% 71
98% 77
99% 87
100% 3059 (longest request)


Remarks


Here are the summary of the time taken to complete requests for each webserver :


200 connections

Yaws :

Time taken for tests: 0.171134 seconds
Requests per second: 1168.67 [#/sec] (mean)
Time per request: 8.557 [ms] (mean)
Time per request: 0.856 [ms] (mean, across all concurrent requests)
Transfer rate: 5855.06 [Kbytes/sec] received

Lighttpd :

Time taken for tests: 0.53806 seconds
Requests per second: 3717.06 [#/sec] (mean)
Time per request: 2.690 [ms] (mean)
Time per request: 0.269 [ms] (mean, across all concurrent requests)
Transfer rate: 18195.00 [Kbytes/sec] received


Apache :

Time taken for tests: 0.89339 seconds
Requests per second: 2238.66 [#/sec] (mean)
Time per request: 4.467 [ms] (mean)
Time per request: 0.447 [ms] (mean, across all concurrent requests)
Transfer rate: 11070.19 [Kbytes/sec] received

WEBrick :

Time taken for tests: 1.435260 seconds
Requests per second: 139.35 [#/sec] (mean)
Time per request: 71.763 [ms] (mean)
Time per request: 7.176 [ms] (mean, across all concurrent requests)
Transfer rate: 686.29 [Kbytes/sec] received


2000 connections

Lighttpd :

Time taken for tests: 0.416057 seconds
Requests per second: 4807.03 [#/sec] (mean)
Time per request: 2.080 [ms] (mean)
Time per request: 0.208 [ms] (mean, across all concurrent requests)
Transfer rate: 23612.15 [Kbytes/sec] received


Apache :

Time taken for tests: 0.658329 seconds
Requests per second: 3037.99 [#/sec] (mean)
Time per request: 3.292 [ms] (mean)
Time per request: 0.329 [ms] (mean, across all concurrent requests)
Transfer rate: 15032.00 [Kbytes/sec] received


Yaws :

Time taken for tests: 1.32380 seconds
Requests per second: 1937.27 [#/sec] (mean)
Time per request: 5.162 [ms] (mean)
Time per request: 0.516 [ms] (mean, across all concurrent requests)
Transfer rate: 9515.88 [Kbytes/sec] received


WEBrick :

Time taken for tests: 13.272744 seconds
Requests per second: 150.68 [#/sec] (mean)
Time per request: 66.364 [ms] (mean)
Time per request: 6.636 [ms] (mean, across all concurrent requests)
Transfer rate: 739.71 [Kbytes/sec] received


Based on the information above, I can infer that the followings are the fastest webserver in descending order :
  • Lighttpd
  • Apache
  • Yaws
  • WEBrick

Please note that the file used is a static webpage. The result may be different if we use a dynamic webpage.

Wednesday, April 05, 2006

Develop A Simple Webserver using Webrick

Last week during my weekend, I got bored with security stuffs. So I tried something new. I read Programming Ruby 2nd edition. In it I found out about Webrick.

I thought this was a cool stuff. With Webrick you can create your own webserver in Ruby. Isn't that cool?

So I hacked the code for a simple webserver :
#!/usr/bin/env ruby
require 'webrick'
include WEBrick

s = HTTPServer.new(
:Port => 2000,

:DocumentRoot => File.join(Dir.pwd,"/home/tedi/public_html")

)

trap("INT") { s.shutdown }
s.start


After that, I started the webserver :
$ ruby webserver.rb
[2006-04-01 22:24:32] INFO WEBrick 1.3.1
[2006-04-01 22:24:32] INFO ruby 1.8.2 (2004-12-25) [i686-linux]

[2006-04-01 22:24:32] WARN TCPServer Error: Address already in use - bind(2)

[2006-04-01 22:24:32] INFO WEBrick::HTTPServer#start: pid=7117 port=2000

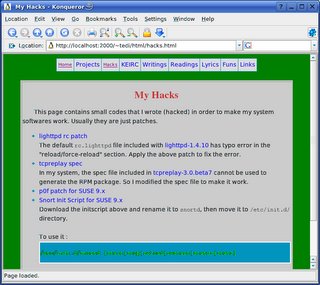
To test it, I launched my browser :


To shutdown the webserver, just press Ctrl-C :
[2006-04-01 22:29:10] INFO going to shutdown ...
[2006-04-01 22:29:10] INFO WEBrick::HTTPServer#start done.