Testing Webserver Performance using IDX-Tsunami
Last night I tried to use IDX-Tsunami. It is a distributed load testing tool. It is protocol-independent and can currently be used to stress testing HTTP, SOAP and Jabber servers.
After download it from its website the installation process was very easy (if you've already had Erlang OTP).
Installation
To install IDX-Tsunami, I just did the followings :
$ tar xvzpf idx-tsunami-1.1.0.tar.gz
$ cd idx-tsunami-1.1.0/
$ ./configure
$ make
# make install
If there is no error, IDX-Tsunami will be installed in directory /usr/local[/bin|/share/doc/|/lib/]
Configuration
If the installation process is easy, the configuration part is quite challenging. :D But luckily I can managed to get the configuration file working.
Here is the scenario I use :
I only have one machine name "suse". It has an IP address at 192.168.1.1. And here is the entry of my /etc/hosts file :
#
# IP-Address Full-Qualified-Hostname Short-Hostname
#
192.168.1.1 suse.site suse
Please do not use IP "127.0.0.1", it doesn't work on my system.
I want to do stress testing to my webserver at "suse" port 80. It contains a simple webpage in "index.html".
I can't show the config file here. It's hidden by this blogger.
Put that config file in $HOMEDIR/.idx-tsunami/
To help you in creating session, there is a helper to do that (recorder). Just start the recorder :
$ idx-tsunami recorder
it will listen on port 8090
Then set your browser to use proxy at that port, and browse the website you want to measure.
When you're done, just give the following command :
$ idx-tsunami stop_recorder
The session name will be created in recorder log file. Here is the content of that file in my system :
< name="'rec20060414-08:13'" popularity="'100'" type="'ts_http'">
<>
< /session>
Just put those lines in idx-tsunami.xml file.
After finish configuring idx-tsunami config file, start the idx-tsunami :
$ idx-tsunami start
Creating idx-tsunami log directory /home/tedi/.idx-tsunami/log
Starting IDX-Tsunami
If there is no error, it will create a directory named "log". In that directory there will be another subdirectory named with current-date and current-time.
In my system, it looks like this :
tedi@suse:~/.idx-tsunami>ll log/
drwxr-xr-x 2 tedi users 4096 2006-04-11 21:04 20060411-14:04
The time is in GMT format.
You can check the status of IDX-Tsunami by using this command :
tedi@suse:~> idx-tsunami status
IDX-Tsunami is running [OK]
Current request rate: 0.782037 req/sec
Current users: 14
Current phase: 1
After that you can wait till the end of the test. In my configuration, the test takes around 10 minutes to finish.
If anytime you want to stop the idx-tsunami before it is finished you can do that by issuing :
$ idx-tsunami stop
Next, you can analyze the results, change the parameters in the configuration file and relaunch another benchmark.
Reporting
To create reports, idx-tsunami needs Template Toolkit and gnuplot. So I installed those packages first.
After successfully installed those packages, I created the statistics report by
issuing the following :
$ cd .idx-tsunami/log/20060414-08:55
$ /usr/local/lib/idx-tsunami/bin/analyse_msg.pl --stats idx-tsunami.log --html --plot
That script will create report.html.
Here is the content of "report.html" in my system :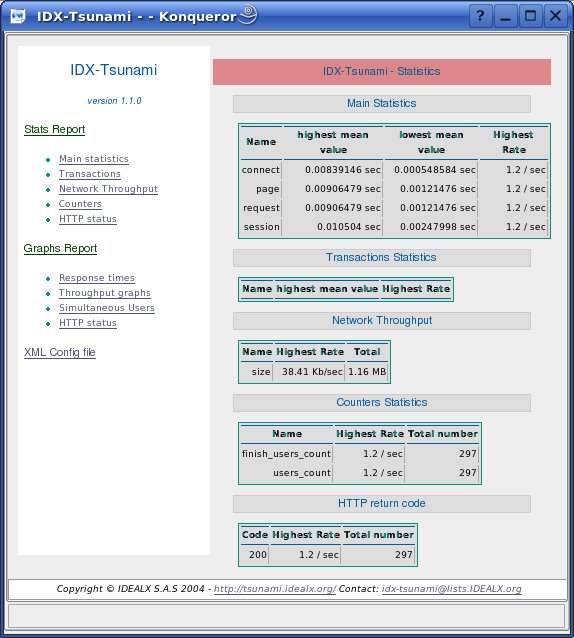

![]() Labels:
hacks
Labels:
hacks
No comments:
Post a Comment